A dashboard that reports activity but not business impact gives leaders only part of the picture. Creating a marketing dashboard for leadership means bringing key marketing measures into a business intelligence view, so leaders can assess performance and explore what is driving the results. It can combine data from multiple sources and show how activity relates to different stages of the sales funnel.
Social engagement, website visits and conversions each reveal something, but none tells the whole story alone. A useful dashboard connects these signals and helps leaders investigate which activities contribute to marketing goals. This article explains what a marketing dashboard shows, how leaders can assess social and wider marketing performance, and how interactive data exploration can turn reporting into clearer business insight.
Key Takeaways
- Choose measures that connect marketing activity to customer progress and business outcomes, rather than filling the dashboard with disconnected figures.
- Assess social channels by looking beyond engagement to site visits and their contribution across the sales funnel.
- Use relevant performance measures, such as email clicks and conversions, to see which activities are advancing marketing goals.
- Drill into results by campaign, channel or funnel stage to find what is driving a change and where action may be needed.
- Treat the dashboard as a business intelligence tool: use its findings to inform decisions, not simply to report activity.
1. What is a Marketing Dashboard?
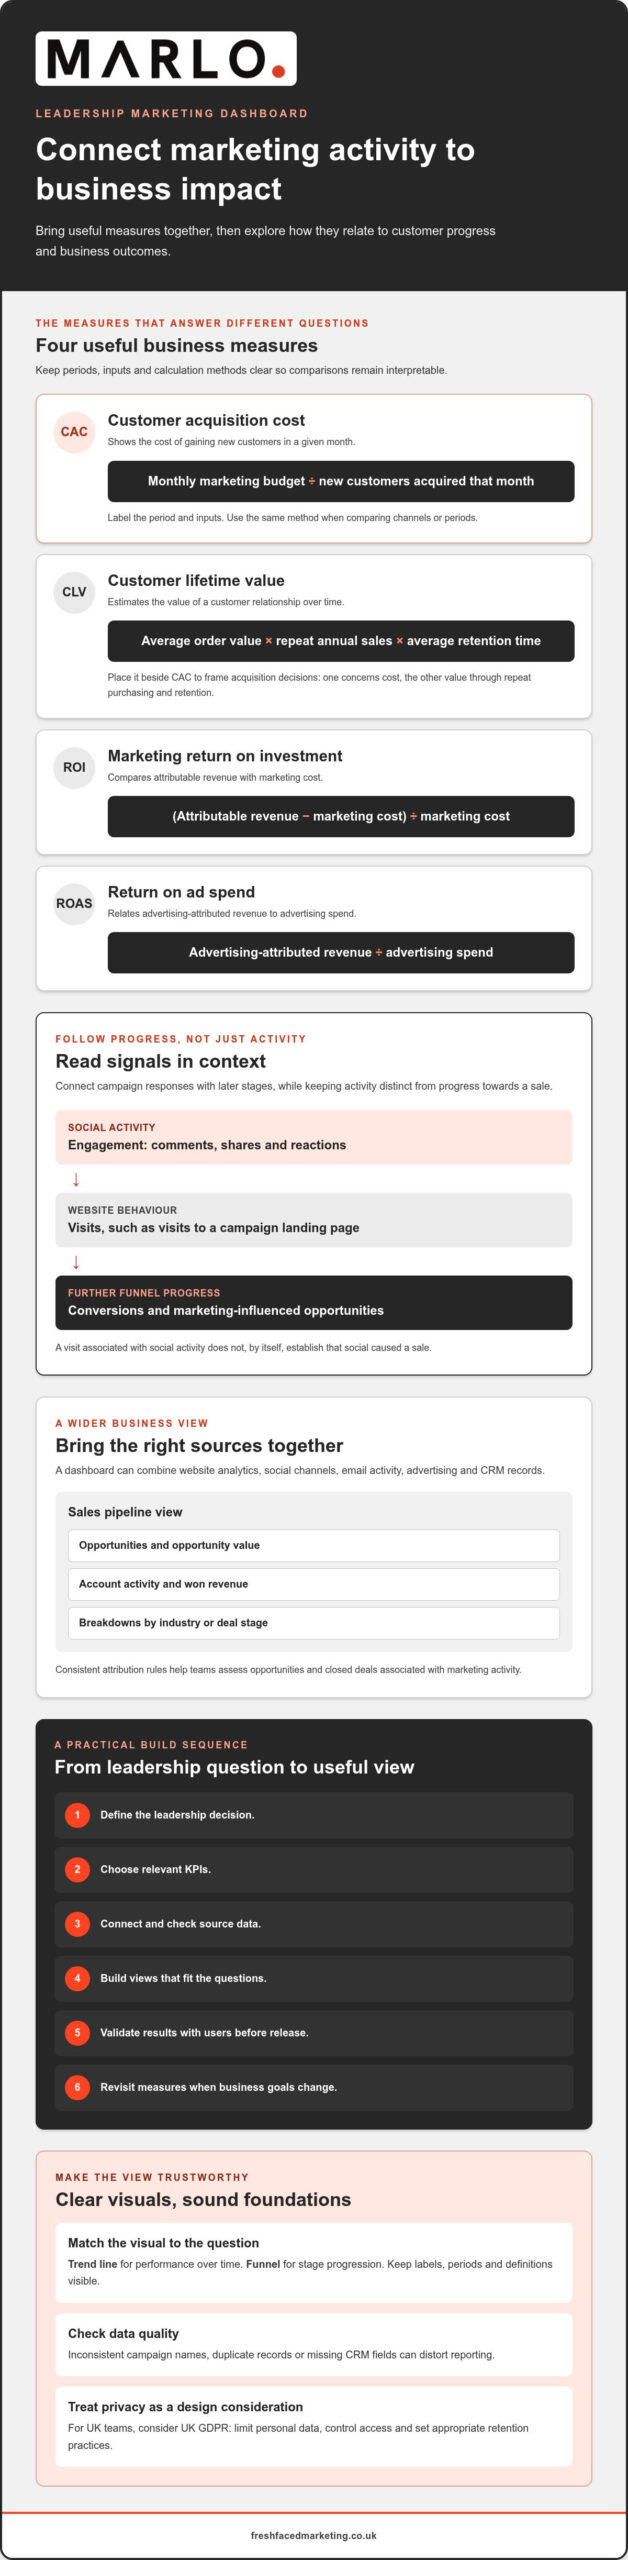
A marketing dashboard brings performance measures from multiple platforms into one view. It can combine website analytics, social channels, email activity, advertising and customer relationship management (CRM) records. When data updates in real time, leaders can see how activity relates to each stage of the sales funnel. The aim is not to display every available metric, but to connect useful measures to decisions about marketing performance and business outcomes.
Integration makes it possible to examine results across programmes and funnel stages. For example, marketing and CRM data can connect a campaign response with a marketing-influenced opportunity. A sales pipeline dashboard can show opportunities, opportunity value, account activity and won revenue by industry or deal stage. These views distinguish activity, such as clicks, from progress towards a sale. They also help teams investigate where leads move forward or stall.
Customer acquisition cost (CAC) gives leaders a simple view of acquisition efficiency. Calculate monthly CAC by dividing the monthly marketing budget by the number of new customers acquired that month. Label the period and inputs clearly in the dashboard. Otherwise, changes in spend or customer numbers can make comparisons misleading. Use the same calculation method when comparing channels or periods, so the measure remains interpretable.
Customer lifetime value (CLV) estimates the value of a customer relationship over time. The calculation described here is average order value multiplied by repeat annual sales and average retention time. A dashboard can place CLV beside CAC to help frame acquisition decisions. The measures answer different questions: CAC concerns the cost of gaining customers, while CLV concerns the value generated through repeat purchasing and retention.
Customer experience measures add another layer. A customer experience dashboard can correlate Net Promoter Score (NPS) with other key performance indicators (KPIs), helping teams investigate patterns linked to customer feedback. Lifecycle views can show how experience changes across key phases. This context can inform full-funnel decisions and campaign spending, rather than treating a sale as the only meaningful point in the customer relationship.
For UK teams, marketing dashboards can create privacy risks if they expose identifiable customer records or combine data without a clear purpose. Treat UK GDPR as a design consideration: limit personal data, control access and set appropriate retention practices. Data quality matters too. Inconsistent campaign names, duplicate records or missing CRM fields can distort CAC, NPS and pipeline reporting.
To calculate marketing return on investment (ROI), compare attributable revenue with marketing cost, then divide the difference by marketing cost. Calculate return on ad spend (ROAS) by dividing advertising-attributed revenue by advertising spend. CAC uses the monthly marketing budget divided by new customers acquired that month. Assess pipeline contribution through opportunities and closed deals associated with marketing activity, using consistent attribution rules.
Match each data visualisation to the question: use a trend line for performance over time and a funnel for stage progression. Keep labels, periods and definitions visible, and use colour consistently to distinguish channels or outcomes. To create and launch a dashboard, define the leadership decision, choose relevant KPIs, connect and check source data, build the views, then validate the results with users before release. Revisit the measures when business goals change.
2. Social media performance
A social media dashboard should show what each platform contributes, not just how often a team publishes. It can connect platform activity with engagement, website visits and influence across the sales funnel. For leadership, that means comparing social activity with meaningful next steps, rather than treating a large interaction count as proof of business impact.
Start with a platform-by-platform view. LinkedIn activity, for example, may serve a different audience or goal from Instagram activity. Compare publishing frequency, engagement and resulting site visits for each channel. Keep the platform, reporting period and metric definition visible. This makes it easier to tell whether an apparent change reflects performance, posting volume or a difference in measurement.
Engagement measures can help explain how audiences respond to content. Track interactions such as comments, shares and reactions alongside content format and subject. A post with fewer interactions may still prompt useful website visits, while a highly shared post may generate attention without clear onward action. Comparing these signals helps teams interpret each metric in context.
Connect social posts to website behaviour where tracking allows. A dashboard might show that a LinkedIn post drove visits to a campaign landing page, then compare those visits with conversions. This helps identify content that attracts attention and content that supports a later funnel stage. Keep the distinction clear: a visit associated with social activity does not, by itself, establish that social caused a sale.
Segment results by channel, content type and campaign. For example, compare video posts with text posts on the same platform, then examine engagement and site visits together. Avoid comparisons that mix different goals or reporting periods. A launch campaign and an always-on brand programme may need separate views because their intended outcomes differ.
Leaders also need to understand how social activity relates to the sales funnel. A dashboard can show engagement at the awareness stage, site visits during consideration and marketing-influenced opportunities further along. This offers a more complete view than a single engagement rate. It can also help teams assess whether social supports demand generation, customer education or another defined objective.
Use the dashboard to identify a practical next step. If a channel attracts visits but few conversions, inspect the landing page and the content’s promise. If engagement is strong but visits remain limited, review the call to action and link placement. If a format performs consistently well, consider testing related topics before changing the wider social plan.
Reliable interpretation depends on consistent definitions. Label organic and paid activity separately where the data supports that distinction, and use consistent campaign names across platforms. Review the same measures over comparable periods. The result is a clearer account of social performance: what was published, how audiences responded and where activity appears to contribute across the funnel.
3. Using dashboards to assess marketing performance
A leadership dashboard should connect marketing measures to decisions, not present an unranked list of activity. A CMO view can show performance KPIs across the marketing funnel, then let executives investigate specific programmes. This structure separates headline results from the activity behind them. Leaders can see whether a change relates to campaign response, lead progression or closed revenue.
Which KPIs should a leadership marketing dashboard include? Select measures that reflect the business objective: lead volume and conversion for demand generation, or opportunities and closed deals for revenue contribution. Email reporting can include send quantities, open rates, click-through rates, click-to-open rates and conversion rates. These measures show how audiences move from delivery to action, rather than relying on opens alone.
Align metrics with objectives by stating the desired business outcome first, then selecting marketing measures that indicate progress. For example, a B2B revenue objective can use opportunities and closed deals associated with marketing activities. An account-based marketing (ABM) objective can track net new named accounts, then analyse response, conversion and revenue by category or individual account.
Different programmes need different views. A B2B marketing contribution dashboard can show revenue, opportunities and closed deals directly associated with marketing activities. An inbound lead dashboard can show lead volume alongside campaign responses and goal activities. For ABM, account-level comparisons can reveal where engagement progresses to conversion, while category views help executives assess broader patterns.
How often should leadership marketing dashboards be updated and reviewed? Refresh the dashboard in line with source data availability and the decisions it supports. Set review points to match the business’s planning cycle, and distinguish current activity from outcomes that take longer to register.
For teams creating a marketing dashboard for leadership, define every KPI before comparing campaigns. Record its calculation, source system, reporting period and attribution approach. If two teams define a “qualified lead” differently, their totals won’t support a reliable comparison. Consistent definitions make movement between marketing activity, pipeline and revenue easier to interpret.
Use the dashboard to investigate exceptions, not merely confirm totals. If email clicks rise but conversions fall, inspect the campaign destination and audience response. If an inbound programme generates leads without corresponding goal activity, examine the steps between enquiry and conversion. A drill-down from executive summary to programme detail helps locate the gap without overloading the main view.
A practical approach to creating a marketing dashboard for leadership keeps executive reporting focused on decision-relevant measures, with supporting detail available for investigation. Show the agreed objective beside each KPI and label the reporting period clearly. Leaders can assess progress, question assumptions and direct attention to programmes that need closer review.
4. Interactive data exploration and drill-downs
An interactive marketing dashboard lets leaders explore data directly instead of relying on a fixed summary. A CMO can select a campaign, channel or funnel stage, then inspect the records behind a change. This helps teams identify insights that can improve marketing effectiveness. The dashboard becomes an investigation tool, not simply a reporting screen.
Begin with a question raised by the summary view. If campaign visits increase but leads remain flat, filter results by campaign and landing page. Compare traffic with conversions to identify pages that may need optimisation. The drill-down should reveal relevant measures and context, rather than sending the reader into a disconnected report.
Useful filters reflect how marketing work is organised. A leader might narrow results by channel, programme, campaign, audience category or deal stage. For example, selecting a B2B programme and an opportunity stage can help show whether campaign activity is associated with pipeline progression. Keep each filter’s effect clear, so viewers understand which records remain in the displayed result.
A practical exploration path can move from an executive-level change to its contributing detail:
- Locate the movement. Select the KPI that changed, such as lead volume or opportunity value.
- Apply a relevant filter. Isolate the programme, channel or funnel stage connected to that measure.
- Compare contributing activity. Review campaign responses, landing-page visits or account activity.
- Inspect the next action. Identify whether a change to targeting, content or follow-up merits investigation.
These steps work best when dashboard measures use consistent definitions. If “lead” means an enquiry in one report and a sales-qualified record in another, a drill-down can create false comparisons. Display the measure’s source and definition beside the result. Where campaign names differ across marketing and CRM systems, standardise them before interpreting programme-level findings.
Interactive exploration also needs sensible boundaries. Give each chart a clear purpose and avoid filters that change several measures without explanation. A viewer comparing channel performance should be able to distinguish the selected period, audience and attribution approach. Otherwise, the same chart can appear to tell different stories as selections change.
Use drill-downs to test explanations, not to imply causation. A rise in campaign responses alongside more opportunities may justify closer analysis, but association alone does not prove the campaign created those opportunities. Check the underlying activity and attribution rules before drawing a conclusion. This keeps leadership discussions grounded in what the dashboard actually measures.
Finally, review exploration paths with the people who will use them. Ask a marketing executive to investigate a real question, such as which programme is associated with stalled opportunities. If answering requires exporting data or rebuilding filters, refine the dashboard’s navigation. A well-designed interactive view helps users move from a headline result to relevant evidence, then decide what to examine next.
5. Marketing dashboards as business intelligence tools
A marketing dashboard becomes a business intelligence tool when it connects performance data to wider commercial decisions. It helps leaders interpret marketing KPIs alongside pipeline, revenue and customer activity. For example, a campaign report may show responses, while a CRM view reveals whether related opportunities progressed. Together, these perspectives support decisions about priorities and investment.
The key distinction is between reporting a result and investigating its business meaning. A dashboard can show that website leads have changed, then help teams examine the campaign responses and goal activity behind that movement. Consistent definitions matter. If marketing and sales count qualified leads differently, their combined view can misrepresent performance and weaken planning decisions.
Which marketing dashboard tools are best for leadership teams? Choose a tool that connects relevant marketing and CRM data, presents agreed KPIs clearly, and lets users explore performance by programme or funnel stage. The best fit depends on existing systems, access needs and the decisions leaders expect the dashboard to support.
Business intelligence also depends on context. Pair activity measures with outcomes, and distinguish marketing-influenced opportunities from deals directly associated with marketing. These views answer different questions. One shows where marketing may have supported progress; the other connects activity to recorded pipeline or closed deals. Clear labels help executives interpret both without treating attribution as certainty.
Useful dashboard design supports a repeatable decision process. First, compare actual performance with the business objective. Next, identify which channel, programme or account contributed to the result. Then decide whether to maintain, adjust or investigate that activity. For an account-based marketing programme, leaders could examine named-account response alongside conversion and revenue by account category.
Which tools suit this approach depends on how well they handle data connections, permissions and interactive analysis. Assess whether the dashboard can combine the sources leadership uses, preserve consistent KPI definitions and support drill-downs. A tool that displays polished charts but separates campaign activity from CRM outcomes may not answer commercial questions effectively.
How much do marketing dashboard and business intelligence tools cost in the UK? Costs depend on the licensing model, user access, data connections, implementation requirements and ongoing maintenance. Assess these factors against the reporting work the tool must support, rather than comparing a licence alone with the total effort involved.
The practical takeaway is to choose the dashboard around decisions, not features. Map each leadership question to its relevant data, agreed measure and useful level of detail. If you’re shaping marketing activity around commercial priorities, explore a data-led marketing strategy to clarify how evidence can inform the next steps.
Fresh Faced: MARLO
MARLO is an interactive dashboard for leaders who need competitor evidence to inform marketing decisions. It complements performance reporting by showing where selected competitors gain visibility, engagement and paid-media presence. Use it when your team needs to identify market opportunities before deciding where to focus.
The dashboard brings competitor search, content, social and paid-media analysis together with a strategic roadmap. For example, leaders can examine which competitor content attracts engagement, compare social activity and assess where paid campaigns are active. Recommendations are prioritised against your goals, budget and resources, helping turn research into practical next steps.
MARLO focuses on competitive insight, rather than replacing a dashboard built around your own CRM and campaign data. If you want to explore how competitor evidence could support your decisions, visit Fresh Faced.
Turn reporting into a decision framework
The next step is to decide which leadership decisions your reporting should support. Then shape the dashboard around those decisions, with clear measures and agreed definitions. This keeps creating a marketing dashboard for leadership focused on practical direction, rather than adding another layer of reporting for its own sake.
Where leaders also need a clearer view of market opportunities, Fresh Faced’s MARLO provides competitor analysis. For teams seeking human-led strategic interpretation and an execution blueprint, the Marketing Strategy Blueprint (MSB) offers a broader strategic route. Full Marketing Strategy Execution can support putting an agreed direction into practice.
Choose the next step that fits your needs. Contact Fresh Faced to discuss dashboards and how marketing insight can inform your wider strategy. A focused conversation can help clarify what evidence your leadership team needs and where to take the work next.
Frequently Asked Questions
What is a Marketing Dashboard?
A marketing dashboard is a visual reporting interface that brings selected marketing measures into a shared view. For example, a leadership team might use it to compare campaign activity with qualified enquiries and sales outcomes. Its value depends on clear definitions: label what counts as a lead, which period each figure covers, and whether results are attributed directly or influenced by marketing. This makes the display easier to interpret and discuss.
How to design an executive marketing dashboard for clear decision-making?
Start with the decision executives need to make, such as whether to extend a campaign or shift resources. Put the relevant outcome near the top, then show the supporting measure and its context. For example, a lead-generation view could pair qualified enquiries with campaign source and sales progression. Use plain labels, consistent colours and a visible reporting period so leaders can interpret the display without decoding internal terminology.
How to connect CRM, web analytics, advertising and finance data in a marketing dashboard?
Connect the systems through shared identifiers, such as campaign names, dates and lead records, then map each field to a consistent definition. For example, link an advertising campaign ID to website visits, CRM opportunities and finance revenue records. Check that time periods, currencies and customer records align before comparing figures. Document attribution rules, since finance revenue and platform-reported conversions may describe different views of the same activity.