What is a customer worth if you count revenue but ignore the cost of serving them? To understand how to calculate customer lifetime value, start by multiplying average revenue per customer by the average length of the relationship. For a more useful estimate, also account for gross margin and customer churn.
This figure can clarify which customer relationships create value over time and whether acquisition spending is proportionate to the return. It is not one fixed number: a historic calculation measures what customers have already spent, while a predictive one estimates what they may spend in future.
This article explains what customer lifetime value measures, how historic and predictive approaches differ, and how to compare CLV with customer acquisition cost. It also explains why the assumptions behind a calculation matter as much as the formula. That context helps turn a headline figure into a more grounded input for marketing and growth decisions.
Key Takeaways
- Estimate customer value by combining revenue, purchase frequency and customer lifespan, then account for the costs of serving customers.
- Use historic CLV to understand past customer spending and predictive CLV to estimate future value.
- Compare CLV with customer acquisition cost to assess whether the return justifies the investment in gaining customers.
- Review the assumptions behind your calculation, including churn, gross margin and differences between customer groups.
- Use customer and market insights to shape marketing priorities, resource allocation and longer-term growth plans.
What is Customer Lifetime Value?
Customer lifetime value (CLV) estimates the revenue or gross profit a business earns from a customer over the course of their relationship. The calculation depends on the business model: a subscription company tracks recurring revenue and churn, while a retailer may focus on order value, purchase frequency and customer lifespan. Choose a measure that reflects how customers buy, then apply it consistently.
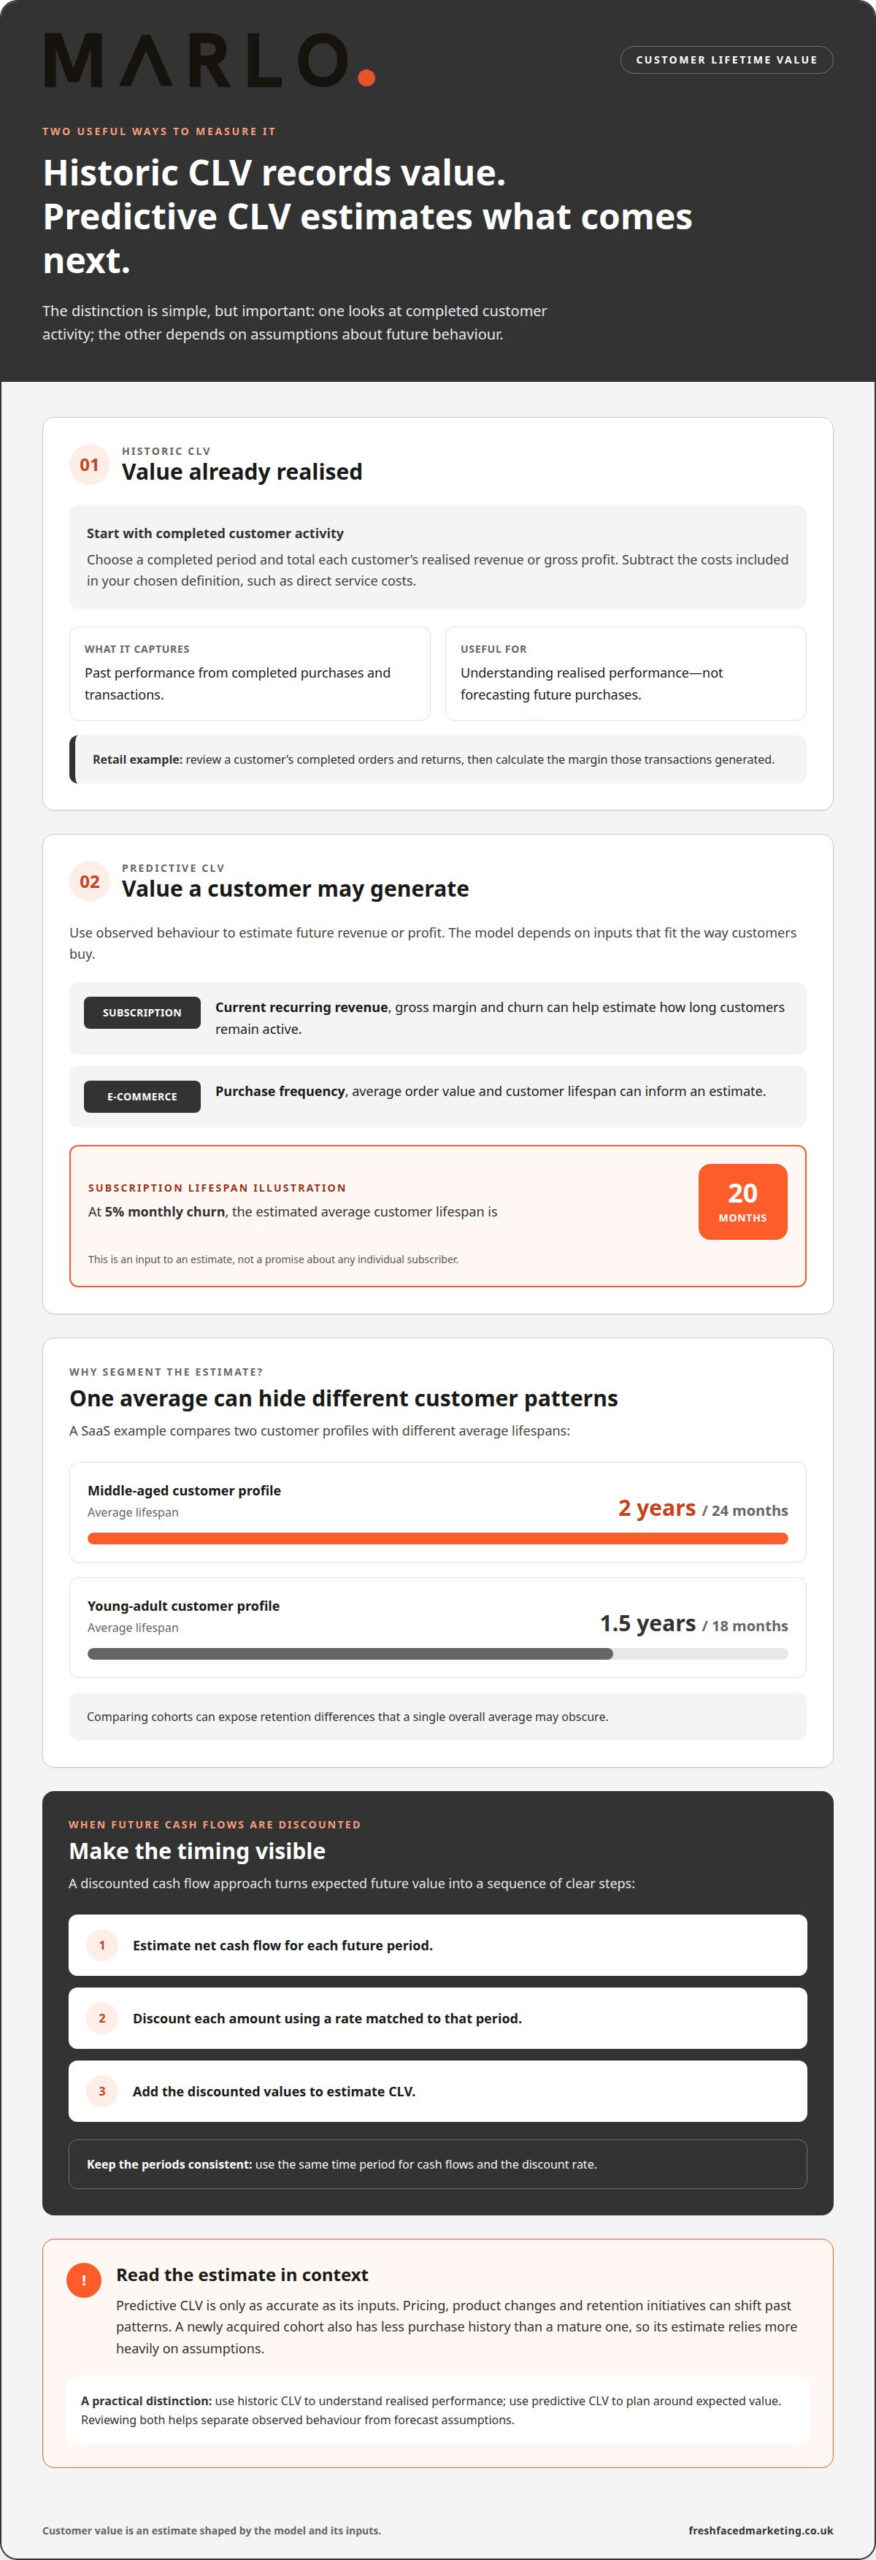
For a SaaS business, a common estimate divides average monthly revenue per customer by monthly customer churn. A more useful margin-based version divides average monthly gross profit per customer by monthly churn. For example, a business with 5% monthly churn estimates an average customer lifespan of 20 months. That lifespan is an input, not a promise about any individual subscriber. Changes in pricing, cancellations or service costs can shift the result.
Customer groups can produce different estimates. One SaaS example has a middle-aged customer profile with an average lifespan of two years, or 24 months, and a young-adult profile with an average lifespan of 1.5 years, or 18 months. Comparing these cohorts helps expose differences in retention. It also shows why one overall average can obscure how customer behaviour varies.
In e-commerce, consider a customer who buys shoes annually and accessories twice a year over five years. Counting both purchase types gives a clearer view than using the first order alone. In a retail café example, a customer visits twice weekly for 50 weeks each year over five years. That pattern gives 500 visits across the relationship. Average transaction value can then be combined with purchase frequency and lifespan to estimate customer value.
Engagement signals help explain customer patterns. Repeat orders, subscription renewals, plan upgrades and responses to marketing can indicate ongoing activity. They provide useful context, but engagement alone does not equal revenue: a customer can interact often without buying. Track these behaviours alongside completed transactions and retention, then compare customer cohorts by acquisition period or purchase pattern.
Common mistakes include using revenue without accounting for gross margin, treating every customer as equally valuable, and overlooking churn or repeat purchases. These choices can inflate an estimate or mask differences between customer groups.
For UK calculations, handle VAT consistently: use net sales revenue rather than mixing VAT-inclusive sales with VAT-exclusive costs. This keeps revenue and service costs on a comparable basis.
Historic versus predictive customer lifetime value
Historic customer lifetime value records value already realised from existing customers. Predictive CLV estimates the value a customer or group may generate in future. The distinction matters: one is based on completed purchases, while the other relies on assumptions about future behaviour.
To calculate historic value, choose a completed period and total each customer’s realised revenue or gross profit. Subtract the costs included in your chosen definition, such as direct service costs. For example, a retailer can review a customer’s completed orders and returns, then calculate the margin those transactions generated. This records past performance, not a forecast of future purchases.
A predictive formula uses observed behaviour to estimate future revenue or profit. A subscription business might use current recurring revenue, gross margin and churn to estimate how long customers remain active. An e-commerce business could use purchase frequency, average order value and customer lifespan. Either model is only as accurate as its inputs: past patterns may change after a pricing shift, product change or retention initiative.
Predictive CLV is useful for comparing customer cohorts, but a single average can hide meaningful differences. Segmenting by acquisition period, subscription plan or purchase pattern can show whether some groups renew or spend differently. The result can inform marketing and retention decisions, provided there is enough observed behaviour to support the forecast. A newly acquired cohort has less purchase history than a mature one, so its estimate depends more heavily on assumptions.
Discounting adjusts expected future cash flows to reflect the time value of money or risk. In a discounted cash flow approach, estimate net cash flow for each future period, discount each amount, then add the discounted values. In shorthand: CLV equals the sum of expected cash flow in period t divided by (1 + discount rate) raised to t. Use the same time period for the cash flows and discount rate.
For a simpler sensitivity check, a conservative estimate can multiply simple LTV by a 0.75 discount factor. An LTV of $2,000 becomes $1,500 under that example, but these dollar figures are not UK market values. The adjustment demonstrates how a lower estimate can account for uncertainty; it is not a substitute for specifying the forecast period and discount method.
How do you calculate customer lifetime value using discounted cash flow? Forecast the customer’s net cash flows period by period, discount each at a rate matched to that period, then add the results. This makes the timing of purchases and assumptions about future value visible.
Use historic CLV to diagnose realised performance and predictive CLV to plan around expected value. Reviewing both helps separate proven customer behaviour from forecast assumptions.
CLV definition and business importance
Customer lifetime value connects the revenue or profit generated by a customer with the length of their relationship. Its practical value depends on defining the customer period and choosing a model that reflects the business.
Defining customer lifetime value
Customer lifetime value is the total revenue a business can expect from a customer throughout their relationship. As a forward-looking metric, it helps distinguish a customer’s potential contribution from a single completed purchase. A subscription business, for example, can use CLV to assess the expected value of continuing accounts, while a retailer can consider repeat transactions. State whether the calculation measures revenue or profit, because these measures answer different questions.
The customer lifetime period
The customer lifetime period is the span during which a customer remains active with the business. In a subscription model, activity may mean having a current paid account; in retail, it may depend on repeat purchases. The definition affects the result: a customer who pauses purchases may count as active in one model but inactive in another. Apply one consistent rule across each segment before comparing results.
Business uses of CLV
CLV helps businesses evaluate customer segments, retention priorities and the economics of customer acquisition. A marketing team might compare segments to see which groups generate stronger long-term contribution, then use that insight to guide investment. It can also inform service and product decisions: a subscription business may investigate whether renewals align with customer value. CLV works best as one input to a decision, not a stand-alone verdict.
For a meaningful comparison, match the metric to the decision. If the question concerns sustainable contribution, use gross profit rather than revenue alone. If it concerns acquisition, compare the same customer group’s CLV with its customer acquisition cost. A blended company-wide average can hide differences between customers acquired through distinct campaigns or buying routes.
- Marketing allocation: Compare segments using the same period and value definition, then assess whether spending reflects their relative contribution.
- Retention planning: Examine renewal and repeat-purchase patterns to identify where keeping an existing relationship may support future value.
- Forecast review: Separate observed transactions from expected future activity, so teams can see which parts of a CLV model rely on assumptions.
For example, a business could compare customers acquired through a campaign with those acquired through referrals. Consistent CLV models can reveal differences in retention, purchasing patterns and contribution. These findings give marketing and finance teams a shared basis for discussing customer acquisition cost, resource priorities and growth plans.
Customer lifetime value to acquisition cost ratio
Customer lifetime value becomes more useful beside customer acquisition cost (CAC). The LTV:CAC ratio compares the value expected from a customer with the amount spent acquiring them. Calculate it by dividing CLV by CAC. A ratio of 3:1 means estimated customer value is three times acquisition cost, before considering how quickly that value returns.
How should customer lifetime value be compared with customer acquisition cost? Compare CLV and CAC for the same customer segment and acquisition period, using consistent cost definitions. Comparing company-wide CLV with campaign-level CAC can distort the result because the figures describe different customer groups.
For example, a SaaS business with CLV and CAC equal has a 1.0x ratio. Its estimated customer value matches the acquisition cost, before other operating expenses. If CLV is three times CAC, the ratio is 3.0x. The ratio shows relative value, not cash flow timing or total profitability, so interpret it alongside payback time and service costs.
A 3:1 LTV-to-CAC ratio is a widely used SaaS benchmark for balancing growth investment and long-term return. Treat it as a reference point, not a universal target. Business maturity, margins, retention, sales cycles and the time needed to recover acquisition spending all influence what is sustainable. A newer business may make different investment choices from an established one.
Higher is not automatically better. An LTV:CAC ratio of 8:1 or 10:1 can indicate that a SaaS business is underinvesting in growth. McKinsey research gives a range of 2:1 to 8:1+ depending on business maturity. The spread underlines why the ratio needs context, rather than a single pass-or-fail threshold.
How do you calculate customer lifetime value using gross margin and customer acquisition costs? First calculate margin-adjusted CLV by multiplying average revenue per customer by gross margin and expected customer lifespan. Then divide that CLV by CAC to get the ratio. Keep the periods aligned, such as monthly revenue, monthly churn and monthly customer acquisition spending.
Define CAC consistently before comparing channels. Depending on the business model, acquisition costs may include marketing and sales spending tied to gaining customers. Decide which costs belong in the calculation, then apply the same definition across campaigns and segments. Otherwise, a channel may appear more efficient simply because some costs were left out.
- Ratio below the intended return: Review acquisition spending, retention and the assumptions used in CLV.
- Ratio near the benchmark: Assess whether margin and payback timing support the level of investment.
- Very high ratio: Consider whether the business could invest more to acquire customers while maintaining sound economics.
Recalculate as customer behaviour changes. A ratio based on outdated churn or acquisition costs can mislead budget decisions. Tracking it by cohort and acquisition channel makes it easier to see where investment generates customer value and where assumptions need attention.
Why customer lifetime value matters
Customer lifetime value matters because it connects customer behaviour with commercial decisions. Without it, a business may focus on first purchases while overlooking repeat revenue, retention and profit. Harvard Business Review reports that acquiring a new customer costs 5-25x more than retaining an existing customer. That comparison makes customer value relevant to acquisition planning and retention strategies.
Retention can affect profit as well as revenue. Bain & Company research reports that a 5% increase in customer retention increases profits by 25-95%. The range reflects different business conditions, not a guaranteed outcome for every company. CLV gives teams a way to examine whether customer relationships and retention activity contribute to sustainable value, rather than treating each sale as an isolated result.
It also helps reveal how value can change over time. Bain & Company found that customers spend 67% more in months 31-36 of a relationship than in their first six months. A business that measures only initial purchase value could miss later spending. Tracking customer value across relationship stages can help identify when retention, service or product strategies deserve closer attention.
For subscription businesses, CLV can be considered alongside net revenue retention. The median SaaS company with net revenue retention of at least 100% grows 48% year over year. This does not mean CLV alone causes growth. It shows why customer expansion and retention metrics can add context when leaders assess recurring revenue and growth plans.
Use CLV to guide decisions, not replace them. Compare customer segments to identify differences in contribution. Consider whether marketing investment reflects expected value and whether a change in churn affects the forecast. Then review the underlying assumptions: revenue, gross margin, customer lifespan and included costs. If one segment has lower CLV, the response might be to improve retention or revisit acquisition strategy, rather than simply cut investment.
CLV is most useful alongside other measures. CAC helps assess acquisition economics, churn shows how quickly customers leave, and gross margin distinguishes revenue from contribution. Together, these measures offer a fuller view than any single figure. Review them by cohort or channel, and update the analysis as customer behaviour changes. This turns CLV from a reporting metric into a practical input for prioritising growth.
If you’re ready to translate customer-value findings into clear marketing priorities, explore a Marketing Success Blueprint with Fresh Faced.
Fresh Faced
Fresh Faced helps businesses turn customer and market insight into evidence-led marketing decisions. When CLV reveals differences between customer segments, acquisition channels or retention patterns, the next step is to decide what those findings mean for priorities, budget and execution.
The Marketing Success Blueprint (MSB) combines competitive analysis with strategic recommendations in an execution blueprint. Full Marketing Strategy Execution supports businesses ready to put a marketing strategy into practice. The right direction depends on your goals, resources and the evidence behind your customer-value estimates.
If you’d like to discuss how customer lifetime value could inform your marketing strategy, contact Fresh Faced.
Turn customer insight into your next decision
A CLV model is more useful when it informs a specific decision. Choose one marketing or retention priority, identify the customer group it affects, and define what evidence would indicate progress. This connects analysis with action instead of leaving the calculation as a report that ends on a spreadsheet.
If you’re refining how to calculate customer lifetime value, make the assumptions part of the decision. Consider which customer behaviours could change, how that would affect your forecast, and how you’ll review the result. A clear view of these factors can help direct attention and resources with greater purpose.
Fresh Faced can help translate customer and market insight into a considered marketing direction. Discuss your goals with Fresh Faced and explore a suitable next step for your business.
Frequently Asked Questions
What’s the difference between CLV and LTV?
CLV and LTV usually refer to the same measure: value generated across a customer’s relationship with a business. Companies may define the terms differently in internal reporting, so check how each metric is calculated before comparing figures. For example, one team might use LTV for revenue and CLV for gross profit. The labels matter less than applying a consistent definition across reports and decisions.
What is the discount rate in the CLV formula?
The discount rate adjusts future cash flows to reflect their value today, including the time value of money or risk. In a discounted cash flow model, apply the rate to each period’s expected net cash flow, using the period number in the calculation. Match the rate’s timing to the forecast, and document why it was selected. Otherwise, two CLV estimates may differ because of assumptions rather than customer behaviour.
How do churn variance and sample size affect LTV?
Churn variance changes estimated customer lifespan, so even a small shift in cancellations can materially affect a forecast. With a small customer base, the observed churn rate can be especially sensitive to individual departures. Separate customer cohorts and review the underlying cancellation patterns instead of relying only on a blended average. If a few accounts dominate revenue, track customer churn and revenue churn separately to reveal different risks.
How does customer acquisition cost (CAC) relate to LTV?
CAC estimates the cost of gaining customers; LTV estimates the value they generate. Comparing them helps assess whether acquisition activity is economically sustainable, but the figures need matching scopes. For example, compare campaign-specific acquisition spending with the subsequent value of customers acquired through that campaign. Include the same types of sales and marketing costs consistently, and account for the delay between spending and customer revenue.
How do you calculate LTV with a small customer base?
With a small customer base, use observed transaction and retention data, but keep forecasts cautious. Group customers by meaningful traits, such as purchase type or acquisition period, only when the groups remain useful for analysis. Compare scenarios based on different retention assumptions, and revisit them as you record more customer behaviour. Avoid treating one unusually large account or one cancellation as a reliable pattern for every customer.
Simple vs margin-adjusted LTV: which formula should you use?
Use simple LTV when you need a revenue-based estimate; use margin-adjusted LTV when the decision depends on contribution after direct costs. For example, comparing two subscription plans by revenue alone may favour the plan with higher sales but greater delivery costs. A margin-adjusted view makes those costs visible. Keep the measure consistent when assessing customer groups, channels or pricing changes.
What is customer lifetime value (CLV or LTV)?
Customer lifetime value estimates the revenue or profit associated with a customer over their relationship with a business. In a business-to-business model, decide whether the unit is an individual buyer or an account, especially when several people purchase under one contract. In retail, a customer may be identified through purchase records. Clear identification prevents one relationship from being counted as several customers.
What is the basic formula for calculating customer lifetime value?
A common basic formula is average transaction value multiplied by purchase frequency and customer lifespan. For subscriptions, a simple model divides average revenue per customer by the churn rate for the same period. Choose the formula that matches how customers buy. If the question is about profit rather than revenue, incorporate gross margin and use costs and periods consistently.