A dataset is not a decision. Knowing how to use market research data effectively means interpreting quantitative patterns alongside qualitative feedback, testing what the evidence supports and turning findings into a clear business choice. A striking result can still mislead if it is an outlier or lacks context.
Research can reduce uncertainty, but collecting figures and comments is only the start. Its value comes from linking evidence to the decision at hand, separating recurring signals from noise and showing what the findings can reasonably support.
This guide explains how to analyse qualitative and quantitative findings, check for gaps or inconsistencies, and present results so decision-makers can use them. It also shows how to turn insights into practical recommendations, from identifying an opportunity to prioritising an action and measuring its effect.
Key Takeaways
- Start with the business decision you need to make, then define the research objectives and evidence required to inform it.
- Combine quantitative patterns with qualitative feedback to understand both what is happening and why.
- Check data for errors, inconsistencies and outliers before treating a finding as a reliable signal.
- Present the methods, assumptions and key findings clearly so decision-makers can see what the evidence supports.
- Turn insights into prioritised recommendations, then track outcomes and refine the approach as new evidence emerges.
Why data analysis is vital in market research
Analysis turns collected responses into evidence for a specific business decision. It helps distinguish recurring patterns from isolated comments before a business commits resources.
For UK research involving personal data, follow applicable data protection rules, including UK GDPR. Research plans should obtain informed consent and protect participants’ anonymity and confidentiality.
-
How professionals collect and analyse market research data
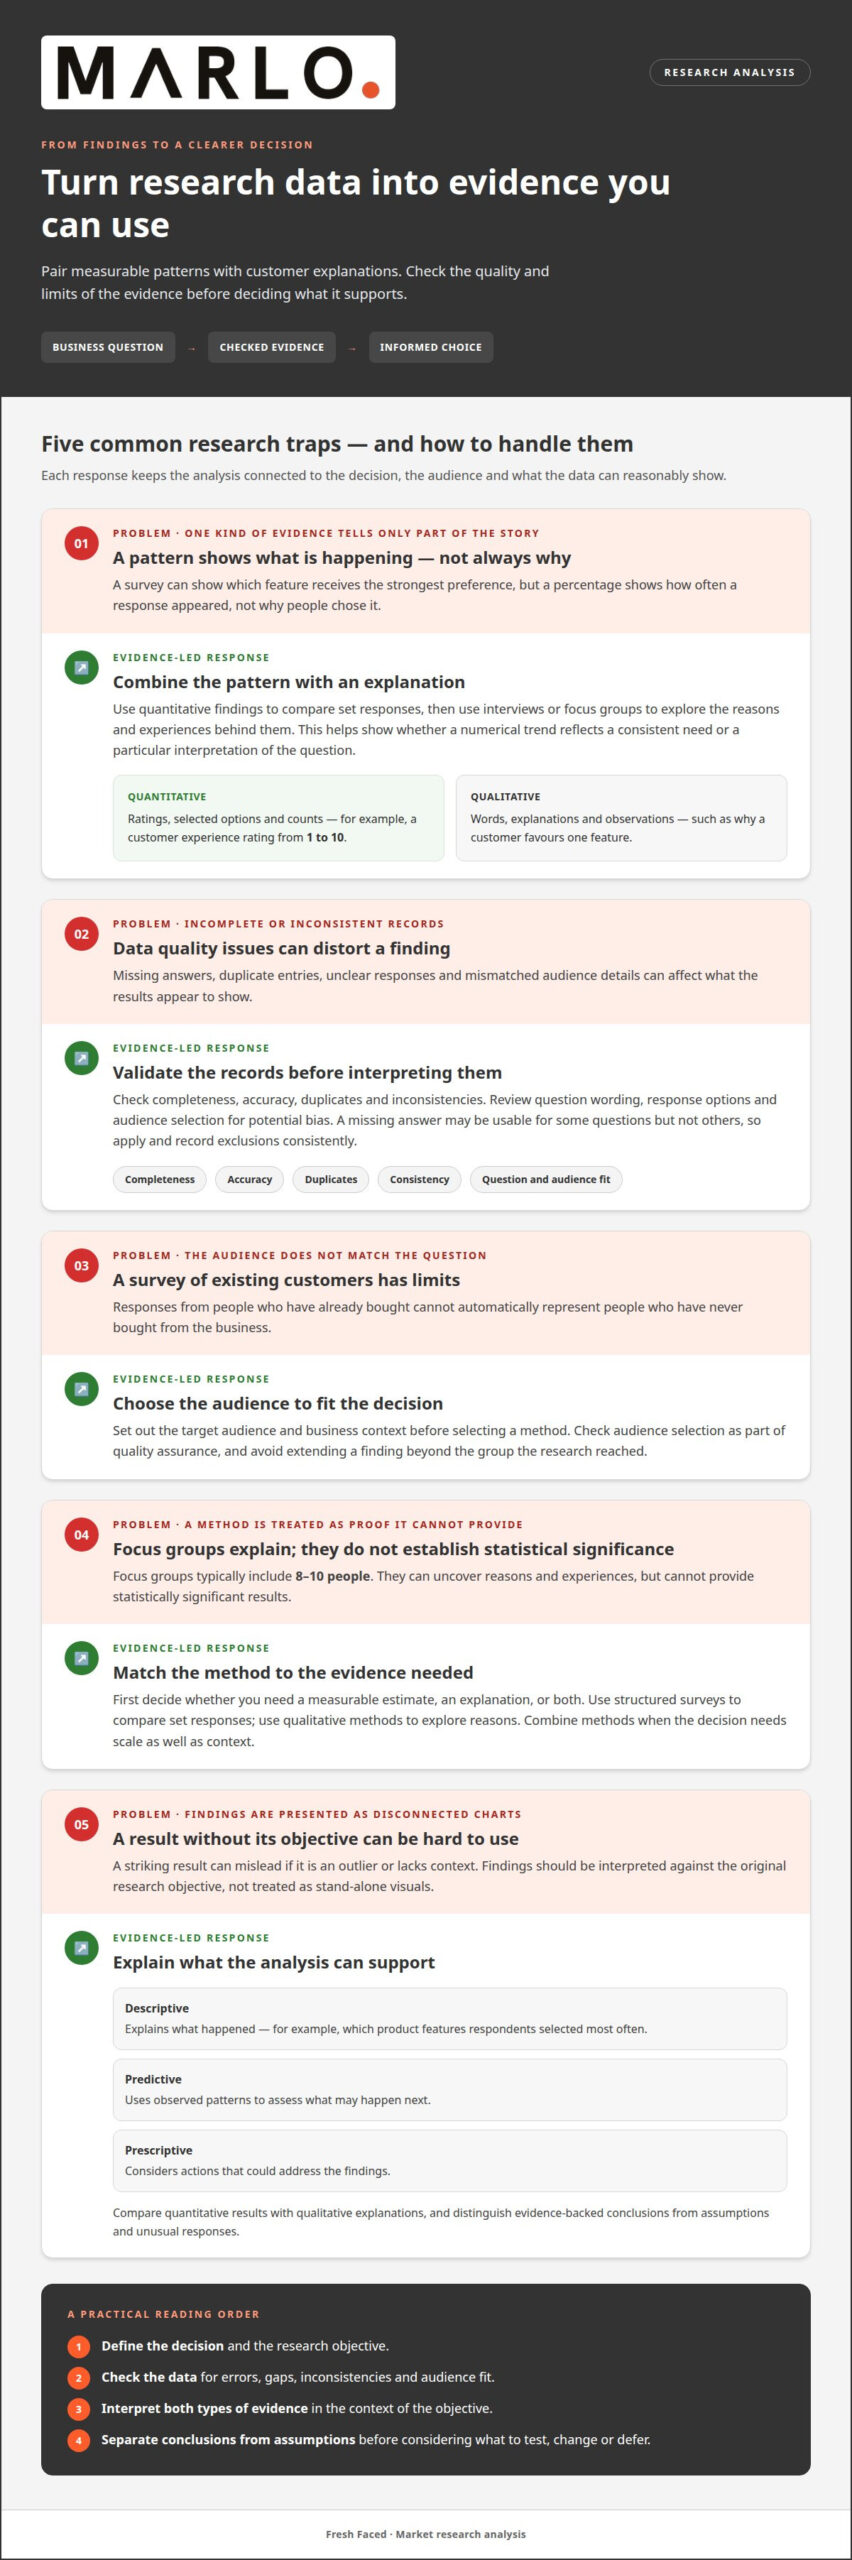
Set out the decision, target audience, existing research and relevant business context. An analyst uses these inputs to select suitable methods, conduct a survey or analyse existing datasets. They check that questions match the research objective and that responses are complete, consistent and relevant. Duplicate entries, unclear answers and mismatched audience details can distort results, so scrutinise them before interpreting the data.
-
How professionals identify trends and drop-off points
Ask the analyst to map behaviour across the customer journey, from first awareness to purchase or renewal. Comparing responses and performance data at each stage can reveal where interest rises, stalls or disappears. For example, strong product interest alongside weak purchase intent points to a different issue from low awareness. Analysts can also compare audience segments, while checking that differences reflect meaningful patterns rather than inconsistent dataset categories.
-
How professionals interpret research findings
Ask for findings to be interpreted against the original objective, not presented as disconnected charts. Descriptive analysis explains what happened, such as which product features respondents selected most often. Predictive analysis uses observed patterns to assess what may happen next. Prescriptive analysis considers actions that could address the findings. Analysts compare quantitative results with qualitative explanations, then distinguish evidence-backed conclusions from assumptions and unusual responses.
-
How professionals use analysis to mitigate business risk
Use the analysis to test important assumptions before making a larger commitment. If a proposed service attracts interest but respondents repeatedly cite a barrier, investigate that barrier before launch. This does not remove uncertainty; it gives decision-makers clearer evidence about what to test, change or defer. When datasets are combined, the Information Commissioner’s Office case study validates segment definitions to identify categories shared across datasets.
Qualitative and quantitative research
Choose methods that fit the decision, then combine measurable patterns with customer explanations where useful. Each data type answers a different part of the problem.
-
How professionals validate research data
Check records for completeness, accuracy, duplicates and inconsistencies before analysis. A survey response with a missing answer may be usable for some questions but not others, so apply and record exclusions consistently.
Quality assurance also means checking how the data was collected. Review question wording, response options and audience selection for potential bias. For example, a survey that only reaches existing customers cannot automatically represent people who have never bought from the business. Clear quality checks help prevent that mismatch from shaping the conclusion.
-
How professionals choose quantitative or qualitative methods
Define whether the decision needs a measurable estimate, an explanation, or both. Quantitative methods, such as structured surveys, help compare set responses across a target audience. Rating a customer experience on a scale from 1 to 10 creates data that can be counted and compared. Fixed response options also make patterns easier to examine through analytics.
Qualitative methods suit questions about reasons, experiences and language. Interviews or focus groups can uncover why a consumer favours one feature or rejects another. Focus groups typically include 8-10 people, but cannot provide statistically significant results; use them alongside other methods. A professional chooses the approach according to the decision, not simply the easiest data to collect.
Combining methods can link scale with context. A survey may show which feature receives the strongest preference, while interviews explore why respondents value it. This helps establish whether a numerical trend reflects a consistent need or a particular interpretation of the question.
-
How professionals distinguish data types
Ask the analyst to classify each finding by what it records. Quantitative data is numeric, such as a rating, selected option or count of responses. Qualitative data captures meaning through words, explanations and observations. A rating of 1-10 is quantitative; a comment explaining the rating is qualitative, even when both come from one survey.
Keep the distinction clear during coding and reporting. Turning comments into themes makes qualitative feedback easier to compare, but those themes are not measured quantities unless the method counts them systematically. Likewise, a percentage shows how often a response appeared, not why.
Sound interpretation accounts for both the data type and its limitations. Structured responses support comparisons, while open feedback adds detail that fixed options may miss. Together, they give decision-makers a clearer basis for judging what the findings support and what needs further investigation.
How can market research help my business grow?
Research supports growth when its objective is tied to a real business decision. A professional first clarifies the context, then selects evidence and measures that can inform the next move.
-
How professionals understand the business context
Give the analyst the business challenge, audience, current offer and decisions under consideration. Context changes what counts as valuable evidence: a retailer exploring new clothing styles needs different insight from a business investigating customer retention. The professional also considers existing performance information and the limits of current knowledge, so the study can uncover a genuine information gap rather than repeat familiar findings.
Explain what success would mean to the people making the decision. For example, a team weighing a new product launch may need to understand customer demand, perceived barriers and the offer’s fit with existing priorities. Use these details to frame research around your circumstances, rather than relying on a generic set of questions.
-
How professionals define objectives linked to business decisions
State the decision first, then convert it into a specific research objective. “Understand customer retention” is broad; “identify why first-time customers do not repurchase within 60 days” gives the analyst a defined question. That focus shapes the audience, information required and suitable method. It also keeps the project relevant to a choice the business can make.
A useful objective is neutral, answerable and bounded. Avoid wording that assumes a preferred outcome, such as asking only why customers like a proposed service. Distinguish the underlying problem from a possible solution. This allows primary research to test the need itself, rather than simply collecting approval for an idea.
-
How professionals choose metrics for the objectives
Match each objective with a measure that can inform the decision. For a retention question, examine repeat purchase behaviour alongside customer explanations. For a product concept, assess stated preference, purchase intent or concerns raised in feedback. The right metric depends on what the business needs to compare or understand, not on which figure looks most impressive.
Define how each measure will be interpreted before collection begins. A count of positive responses means little without knowing who responded and what question they answered. Record the relevant audience, response categories and decision criteria so emerging patterns can be interpreted consistently against the research objective.
-
How professionals collect relevant data
Work backwards from the objective to identify the evidence needed. Primary research gathers original responses from the intended audience; secondary research provides benchmarks and competitor context. Select sources that address the question directly, and avoid gathering unrelated information that adds volume without helping the decision.
For a service business investigating customer experience, interviews could explore specific parts of the service journey, while structured survey questions compare feedback across customers. Check that the selected audience reflects the objective and that each question contributes useful evidence. This focused approach makes findings easier to interpret and apply to the decision.
Presenting findings and turning insights into decisions
Combine primary research with secondary sources by using published evidence for context, then original findings to investigate your audience’s specific questions. A professional can present the resulting insights as clear decisions, supporting evidence and practical next steps.
-
How professionals summarise findings into insights
Connect each finding to the business question it addresses. A concise insight states the audience, the pattern and its possible significance. For example, customers may favour a service feature, but interviews might reveal that confusing instructions limit uptake. Presenting both signals gives decision-makers more useful context than a chart alone.
Separate observed evidence from interpretation. A summary should identify the source, method and relevant limitations, then explain what the findings support. Do not present correlation as proof of cause. This distinction helps colleagues assess the evidence and understand how the analysis informs a choice.
- Use secondary sources to establish context before interpreting primary findings. Relevant material can include government departments, libraries, financial and educational institutions, periodicals and industry studies. A professional assesses how closely each source matches the target audience, market and question. A broad industry report may indicate competitive conditions, while interviews with your own customers reveal specific experiences.
Combine sources by comparing definitions, audience categories and time periods. If a published study groups customers differently from your survey, account for that difference rather than merging unlike categories. Primary research adds direct evidence; secondary research supplies benchmarks and wider context.
-
How professionals use insights in business strategies
Translate each insight into a strategic implication, then connect it to a business priority. If research identifies a barrier in the purchase journey, the strategy might prioritise clearer product information before increasing promotion. Explain which finding supports the recommendation, whom it affects and how it relates to the organisation’s objectives.
Share relevant findings across teams so marketing, sales and product decisions reflect the same evidence. For example, a sales team hearing repeated objections can use research insights to refine its messaging. State which evidence would indicate progress, so the business can compare outcomes with its intended direction.
-
How professionals turn findings into improvements
Prioritise improvements by weighing evidence, business relevance and practical constraints. A finding affecting a core audience may deserve attention before a less common preference. Where a broad change is difficult, recommend a focused adjustment, such as revising one step in a service journey, then assessing the response.
Record the action, its rationale and the evidence used. This creates a clear link between research and implementation. Teams can monitor new data, learn whether the change addressed the identified issue and refine their approach. Incremental improvements keep findings in use rather than leaving them in a report.
Turning research data into actionable recommendations
A recommendation should link a specific finding to a decision, an action and a way to measure progress. Build that chain before presenting the next steps.
- Translate the finding into a decision. Identify what the evidence changes for the business. If customer preferences favour a simpler product offer, the decision might be whether to revise the range or test clearer product descriptions. State which finding supports the decision, whose behaviour it concerns and what choice the business can make. This keeps analysis focused on action rather than observation alone.
- Combine evidence to identify useful patterns. Cross-tabulation compares responses across questions or audience groups. For example, analysts might compare product preferences by demographic alongside reasons given in open-text feedback. Bringing relevant evidence together can reveal where a pattern holds across groups and where it differs. Check that categories are comparable before drawing conclusions, and do not treat a difference as meaningful without support from the underlying data.
- Develop a recommendation that addresses the cause. A finding describes what the data shows; an actionable recommendation explains what to do next. If customers report difficulty understanding a service, test revised explanations before changing the service itself. Identify the intended audience, proposed change and supporting evidence. This reduces the risk of addressing a symptom while leaving the underlying issue untouched.
- Prioritise actions against business objectives. Consider how closely each recommendation supports the decision, what evidence underpins it and what implementation requires. For example, a business could prioritise an adjustment affecting a key customer journey over a change based on a small set of unrelated comments. Where evidence supports several options, sequence recommendations so the most relevant issue comes first.
- Define how the action will be assessed. Link each recommendation to a measure of its intended outcome. If the business changes product descriptions, it could monitor relevant customer responses and behaviour after implementation. The measure should reflect the original research objective, not simply whichever figure is easiest to collect. Identify what further data would clarify, helping the business refine its approach as new evidence emerges.
For a structured route from research evidence to prioritised marketing actions, discuss your strategic recommendations.
Fresh Faced
Fresh Faced helps businesses turn market and competitor research into decisions grounded in evidence. If your team has data but needs clearer priorities, MARLO provides an interactive dashboard analysing competitors’ search, content, social and paid activity. For deeper human-led analysis, the Marketing Success Blueprint (MSB) adds strategic interrogation and a detailed execution blueprint. Full Marketing Strategy Execution supports businesses ready to put their chosen direction into practice.
The right next step depends on the gap: clearer visibility of your competitive landscape, expert interpretation, or support to carry a strategy through. Connect evidence with practical choices, priorities and resources, rather than treating a report as the endpoint.
Contact Fresh Faced to discuss how market research could inform your business decisions.
Make the next decision evidence-led
Research earns its place when it helps your team choose what to do next. Knowing how to use market research data effectively means setting a decision rule: which evidence would change your course, who will act on it and when you’ll review the outcome. This keeps analysis connected to the work, rather than treating a report as the finish line.
As you decide how to use market research data effectively, focus on the choice in front of you. You may need to test an assumption, prioritise an opportunity or pause an activity that lacks supporting evidence. The right next step depends on your organisation’s goals and what the findings can reasonably support. Revisit the decision as new information becomes available.
If you’d like to discuss how evidence could shape your next marketing decisions, start a conversation with Fresh Faced. A considered next step can help your team turn insight into focused action.
Frequently Asked Questions
How can companies profit from market research?
Companies can use research to make choices that improve revenue or reduce wasted investment. For example, customer evidence may show which product features matter most, helping a business refine its offer or messaging. Research can also reveal unmet needs or barriers to purchase. To assess commercial value, compare the decision’s costs and outcomes, such as sales, retention or contribution margin, rather than treating positive feedback as profit.
What different methodologies can be used?
Common methodologies include surveys, interviews, focus groups, observation, experiments and analysis of published information. Choose a method to fit the decision: interviews can explore unfamiliar customer concerns, while an experiment can compare two versions of an offer. A study may combine methods when one approach cannot answer the whole question. Its design should also account for who can take part and whether responses reflect the intended audience.
How do you evaluate the success of market research?
Evaluate research by asking whether it answered the original business question and informed a decision. Before the work begins, agree how the findings will be used and what outcome matters, such as improved repeat purchasing or fewer abandoned enquiries. Afterwards, assess whether the chosen action affected that measure. A study can still be useful if it rules out an unsuitable option and prevents a poorly informed commitment.
What are the benefits of effective market research?
Effective research helps a business understand customer priorities, assess opportunities and make better-grounded choices. It can sharpen product positioning, expose unmet demand and identify concerns that obstruct a purchase. For example, a service provider might discover that prospective customers value clear onboarding more than additional features. That insight can guide a focused change. Research also gives teams a shared basis for discussing priorities instead of relying solely on internal assumptions.
What are the best tools and techniques for market research?
The best tools suit the study and the people taking part. Survey platforms can organise structured responses; interview guides can keep conversations focused; spreadsheets or dashboards can help analysts review patterns. Tools do not fix weak questions or an unsuitable sample. For example, a well-designed interview can reveal the reasons behind a customer concern, while a dashboard can make recurring response categories easier to compare.
Why is market research the cornerstone of your marketing strategy?
Market research gives a marketing strategy evidence about the people it aims to reach and the conditions in which the business competes. It can inform positioning, channel priorities and messages relevant to potential customers. It is a foundation, not a substitute for sound planning or ongoing assessment. For instance, research may identify a customer need, while later campaign data helps assess whether the chosen message reaches that audience.
What types of market research data are available and how reliable are they?
Market research data can be quantitative, such as survey ratings, or qualitative, such as interview comments. It can also be primary, collected for a particular study, or secondary, drawn from existing publications and datasets. Reliability depends on the source, collection method, audience fit, question wording and relevance to the decision. Older industry data may provide context, but it may not reflect current customer behaviour or a specific market.
How do you define research objectives and choose the right data for a business decision?
Start by naming the decision, then identify what evidence would help distinguish between the available options. If a business is considering a new service, it might need to understand the intended audience’s needs, current alternatives and reasons for hesitation. Choose data that answers those points, not information that is merely easy to collect. The objective should also clarify who needs the findings and how they will use them.